How to Calculate Standard Deviation: Step-by-Step With Examples
Short answer
Standard deviation tells you how spread out numbers are from their average. To find it: (1) work out the mean, (2) subtract the mean from every value, (3) square each difference, (4) add the squares and divide by n for a whole population or by n − 1 for a sample, then (5) take the square root. Example: quiz scores 6, 7, 8, 9 and 10 have a mean of 8, a population standard deviation of about 1.41 and a sample standard deviation of about 1.58.
Two classes can have exactly the same average test score and still be very different. In one, almost everyone scored close to the average; in the other, some students aced it and some struggled. The average alone hides that difference. Standard deviation is the number that shows it. It turns up in school maths and science labs, in sports statistics, in quality control at factories and in almost every research report. The good news is that the method is the same five steps every time, and once you have done it by hand once, you will understand what our free standard deviation calculator is doing for you.
What standard deviation actually measures
Think of the mean as the centre of your data. Standard deviation is roughly the typical distance between a value and that centre. A small standard deviation means the values are bunched tightly around the mean. A large one means they are scattered widely. It is always zero or positive, and it uses the same units as your data: if you measure heights in centimetres, the standard deviation is in centimetres too, which makes it easier to read than its close cousin, the variance.
If you need a refresher on the centre first, our guide to mean, median and mode explains the three kinds of average and when each one is useful.
The five steps
- Find the mean. Add all the values and divide by how many there are (n). The average calculator does this instantly.
- Find each deviation. Subtract the mean from every value. Some answers will be negative; that is expected.
- Square each deviation. Squaring removes the minus signs, so values below and above the mean do not cancel out.
- Average the squares. Add the squared deviations. Divide by n if your numbers are the whole group you care about (population), or by n − 1 if they are a sample taken from a bigger group. The result is the variance.
- Take the square root. The square root of the variance is the standard deviation, back in the original units.
In symbols, the population version is σ = √( Σ(x − μ)² ÷ N ) and the sample version is s = √( Σ(x − x̄)² ÷ (n − 1) ). The symbols look scary, but they say exactly what the five steps say.
Example 1: five quiz scores
Five students score 6, 7, 8, 9 and 10 out of 10 on a quiz.
| Score (x) | x − mean | (x − mean)² |
|---|---|---|
| 6 | −2 | 4 |
| 7 | −1 | 1 |
| 8 | 0 | 0 |
| 9 | 1 | 1 |
| 10 | 2 | 4 |
| Total | 0 | 10 |
- Mean: (6 + 7 + 8 + 9 + 10) ÷ 5 = 40 ÷ 5 = 8
- Sum of squared deviations: 10
- Population variance: 10 ÷ 5 = 2, so the population standard deviation is √2 ≈ 1.41
- Sample variance: 10 ÷ 4 = 2.5, so the sample standard deviation is √2.5 ≈ 1.58
Notice that the deviations in the middle column always add up to zero. That is a handy check: if yours do not, the mean is wrong. Paste the five scores into the calculator and you will see the same two answers side by side, along with the mean, median and range.
Example 2: same average, very different spread
Here is why the average is not enough. Team A's five players scored 8, 8, 8, 8 and 8 points. Team B's scored 4, 6, 8, 10 and 12. Both teams average exactly 8 points a player.
- Team A: every deviation is 0, so the standard deviation is 0. The team is perfectly consistent.
- Team B: the deviations are −4, −2, 0, 2 and 4. Their squares are 16, 4, 0, 4 and 16, which add up to 40. The population variance is 40 ÷ 5 = 8, giving a standard deviation of √8 ≈ 2.83. The sample version is √(40 ÷ 4) = √10 ≈ 3.16.
A coach would read these numbers very differently. Team A can count on steady scoring from everyone; Team B relies on a couple of stars. The same idea applies to your own marks: two students with the same weighted average can have very different patterns, and a low standard deviation means steady performance across subjects.
Sample or population: which one should you use?
This is the question that trips most people up, so here is the plain-language rule:
- Population (divide by n): your numbers are the entire group you want to describe. The marks of every student in your class, if you only care about that class, are a population.
- Sample (divide by n − 1): your numbers are a smaller set picked to learn about a bigger group. Surveying 50 shoppers to understand all of a store's customers is a sample.
Dividing by n − 1 (called Bessel's correction) makes the sample result slightly larger. That makes up for the fact that a small sample usually underestimates how spread out the whole group really is. With large data sets the two answers become almost identical. Most school worksheets and science labs want the sample version unless the question says otherwise, so check the wording, and if you are unsure, show both.
How to read your answer
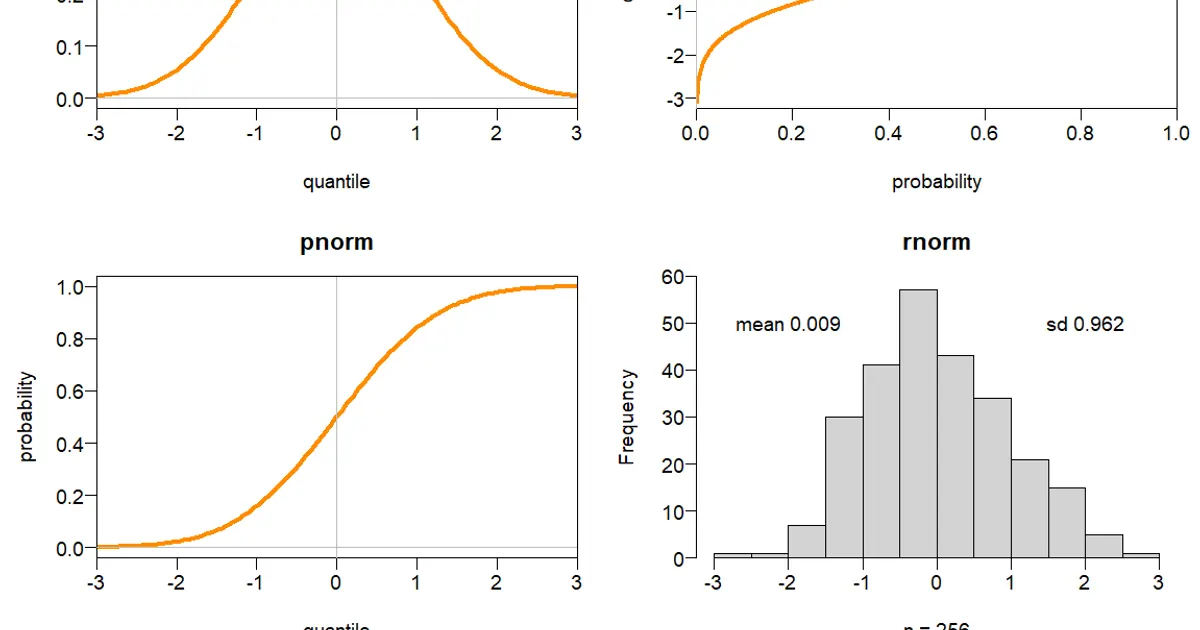
For data that forms a rough bell shape (heights, many test scores, measurement errors), a useful guide is the 68-95-99.7 rule: about 68% of values fall within one standard deviation of the mean, about 95% within two, and about 99.7% within three. So if a large exam has a mean of 70 and a standard deviation of 10, roughly two out of three students scored between 60 and 80. A score of 90 is two standard deviations above the mean, which is unusually high.
Two cautions. First, the rule only works for bell-shaped data; skewed data such as incomes does not follow it. Second, one extreme value can inflate the standard deviation a lot, so look at your numbers before trusting the result. If you want to express a single score's position as a percentage instead, our guide to calculating a grade percentage and the percentage calculator can help.
Doing it in a spreadsheet
Excel, Google Sheets and LibreOffice all have built-in functions. Use STDEV.S (or STDEV) for a sample and STDEV.P for a population, for example =STDEV.S(A1:A5). If your spreadsheet answer does not match your hand calculation, the usual cause is mixing up the two functions.
Common mistakes to avoid
- Forgetting the square root. If you stop after step 4, you have the variance, not the standard deviation.
- Dividing by the wrong number. Decide sample or population before you start.
- Rounding the mean too early. Keep a few extra decimal places until the final step, or small errors pile up.
- Adding deviations without squaring them. They always cancel out to zero, which tells you nothing.
VSH take: standard deviation feels abstract until you use it on something you care about, like your own test marks or your team's scores. Try it with the last five results you got in any subject. A small number means you are consistent; a big one tells you which topics to revisit before the next exam. If exams are coming up, our final exam grade guide and exams hub are good next stops, and the study guides cover board and entrance exams. This guide is general learning material; always follow the method your teacher or exam board asks for.
Frequently asked questions
What is the simplest way to explain standard deviation?
It is the typical distance between the values in a list and their average. A small standard deviation means the values are close together; a large one means they are spread out.
What is the difference between sample and population standard deviation?
Population standard deviation divides the sum of squared deviations by n, the number of values. Sample standard deviation divides by n − 1, which gives a slightly larger answer to correct for the fact that a sample usually underestimates the spread of the whole group.
Can standard deviation be negative?
No. Because the deviations are squared and the final step is a square root, the answer is always zero or positive. It is zero only when every value is the same.
How is variance related to standard deviation?
Variance is the average of the squared deviations, and standard deviation is its square root. Standard deviation is easier to read because it is in the same units as the data.
Which spreadsheet function should I use?
Use STDEV.S for a sample and STDEV.P for a whole population in Excel or Google Sheets.