What you are looking at
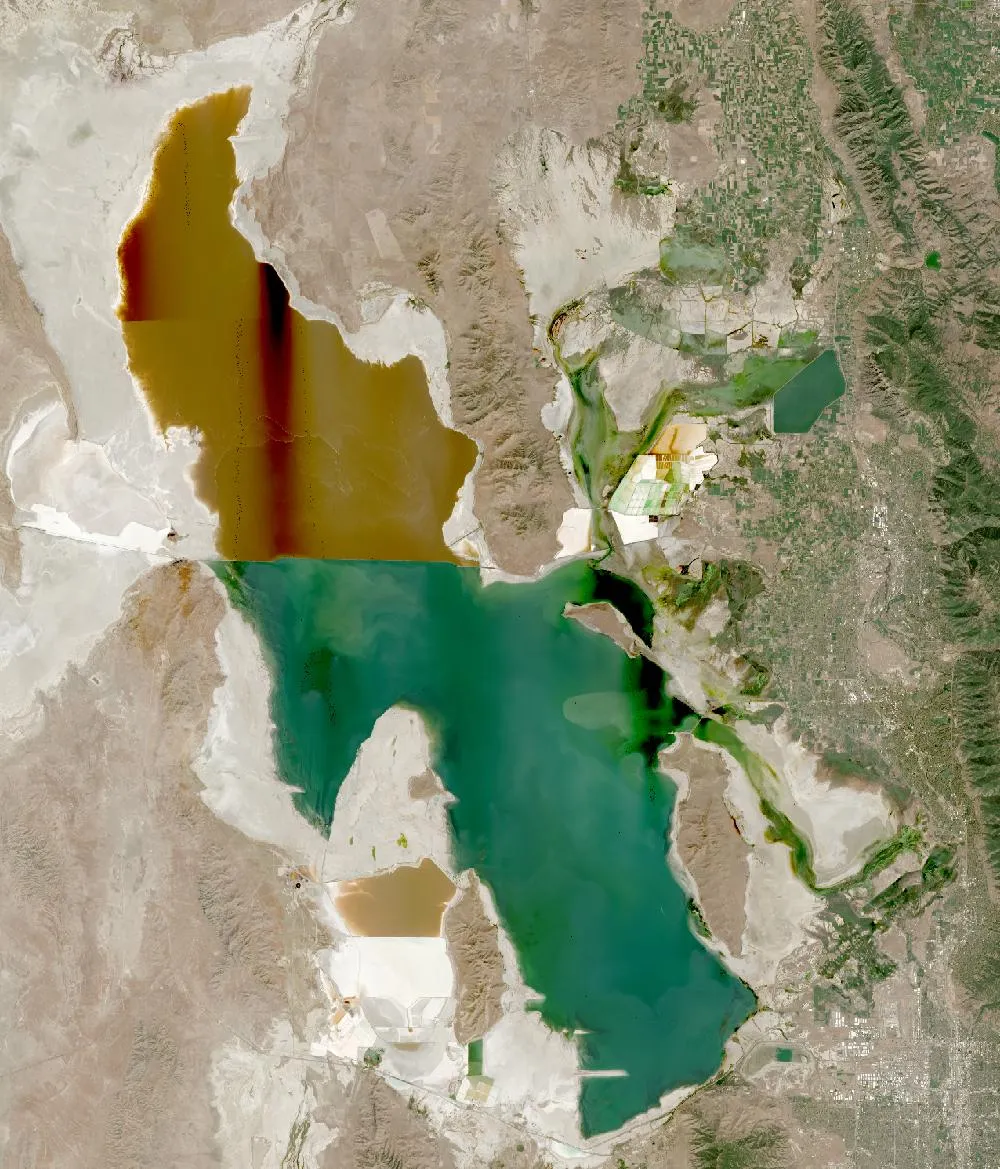
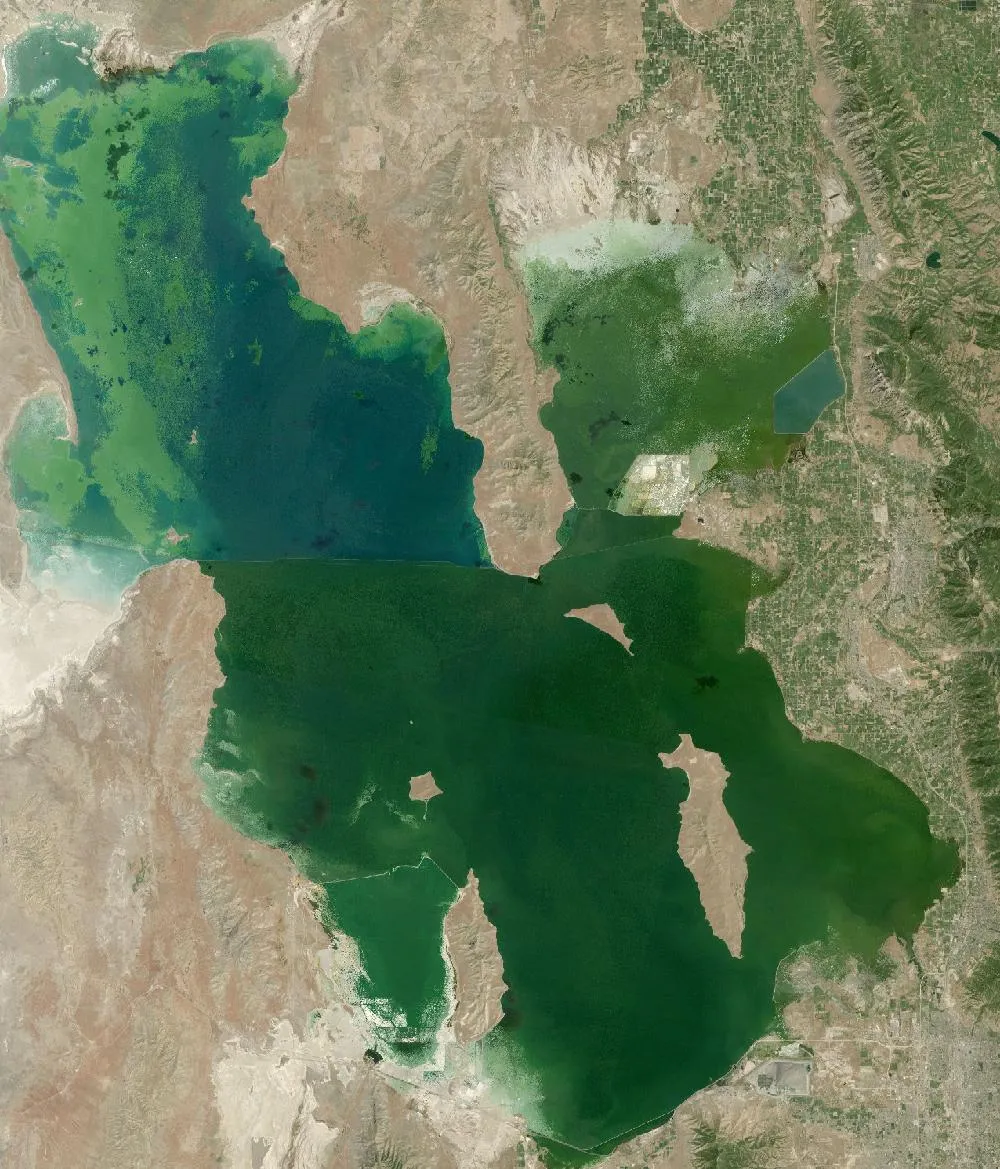
The left image is a 1985 Landsat composite, when Great Salt Lake was close to its highest level on record. Water spreads wide across the flat basin. The right image is recent. Large areas of pale, dry lake bed now ring the shore, especially in the shallow bays in the north and east. You can also see a sharp colour line across the lake where a railway causeway splits it in two.
A lake that rises and falls
Great Salt Lake has no outlet, so it loses water only by evaporation. Its size depends on how much water flows in from rivers and how much evaporates. In the wet years of the mid-1980s it rose to its highest recorded level, flooding roads and farms. In November 2022 it fell to its lowest level on record. Scientists say about two-thirds of the drop comes from people taking river water for farms and cities before it reaches the lake, and the rest from drought and heat.
Why one half is pink
In 1959 a solid railway causeway was built across the lake. The northern arm now gets very little fresh river water, so it is saltier. Salt-loving microbes turn it pink and red. The southern arm, which gets the rivers, looks blue-green.
Why it matters
The lake is a stop for millions of migrating birds, which eat the brine shrimp and brine flies that live in the salty water. It also supports jobs in mineral production and brine-shrimp harvesting. When the lake bed dries, wind can blow dust containing natural minerals towards Salt Lake City. Utah has passed laws to send more water to the lake, and a wet winter in 2023 helped it rise again.
How to read the images
Deep water looks dark, shallow water looks green or turquoise, salt flats and dry lake bed look white, and the north arm looks reddish-brown. Some strips and lines in the recent image come from how the satellite pictures were joined together.
For more years of change, explore Google Earth Timelapse (opens in a new tab), which shows Landsat images from 1984 to recent years for anywhere on Earth.
Frequently asked questions
Why is Great Salt Lake shrinking?
Mostly because people divert river water before it reaches the lake, made worse by drought and warmer temperatures.
Why is part of Great Salt Lake pink?
A railway causeway cut off the northern arm from river water, making it very salty, and salt-loving microbes colour it pink and red.
Where do these images come from?
Both images are from NASA and USGS Earth-observing satellites (Landsat and the joint NASA HLS product). They are free public-domain data, and we host copies on our site.
More Earth then and now
Data and credits: Satellite images: NASA/USGS Landsat via NASA GIBS (Global Web-Enabled Landsat Data, 1985 annual composite) and NASA Harmonized Landsat Sentinel-2 (HLS), 2024-08-27, Sentinel-2 (HLS S30). Public domain (NASA/USGS); HLS Sentinel-2 data includes modified Copernicus Sentinel data, free and open. Imagery accessed through NASA Worldview/GIBS. Text written by ViralScopeHub from NASA Earth Observatory, USGS and other public sources. See all Live Earth & Space tools and our credits page.