What you are looking at
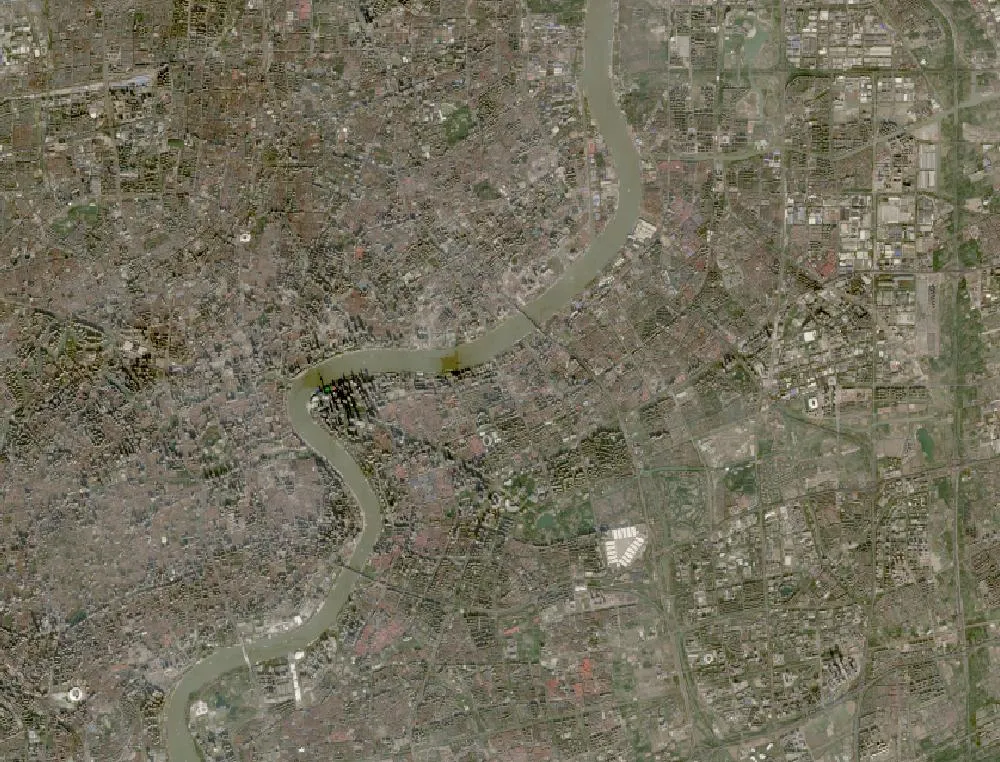
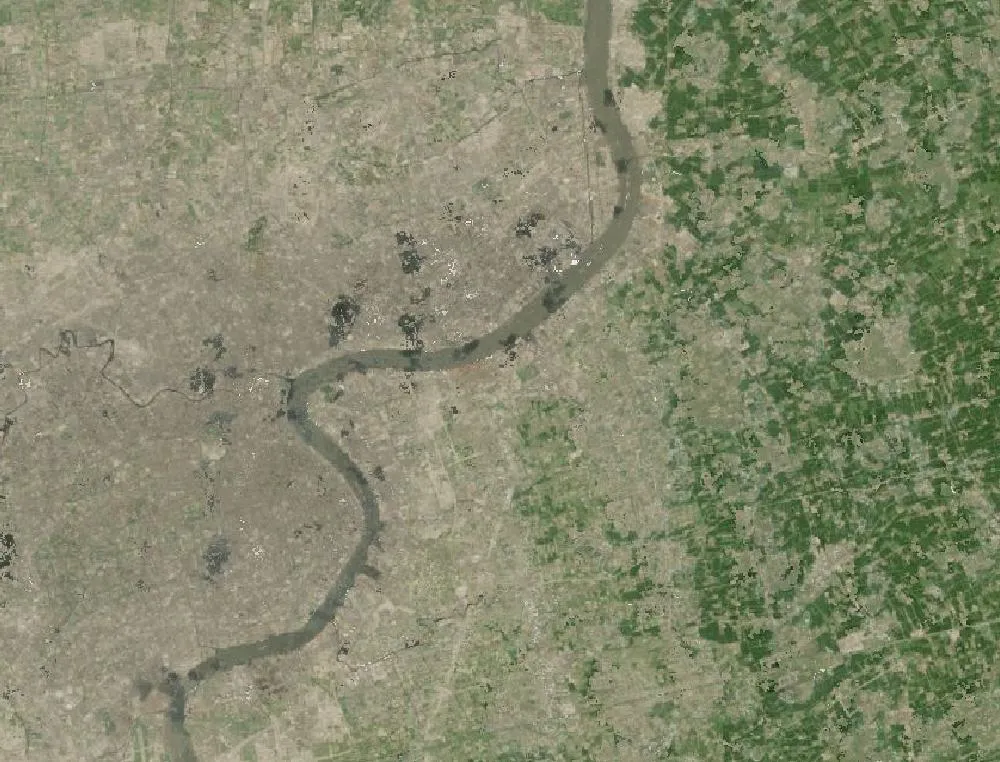
The images show central Shanghai with the Huangpu River curving through the middle. The old city and the Bund are on the west bank. Pudong is on the east bank. In the 1985 Landsat composite, much of the east side is a patchwork of fields, villages, docks and factories, with fewer large buildings. In the recent image the whole area is dense grey city, with wide roads, parks and the high-rise district of Lujiazui on the river bend.
A new district on purpose
In 1990 China’s government announced the Pudong New Area to make Shanghai a world centre for finance and trade. Bridges and tunnels were built across the Huangpu, which had separated the two banks. The Oriental Pearl TV Tower opened in 1994. Skyscrapers followed, including the Jin Mao Tower, the Shanghai World Financial Center and the Shanghai Tower, which at 632 metres is one of the tallest buildings in the world.
Pudong also gained a new international airport, metro lines, a huge port area and science parks. Millions of people now live and work in a district that was mostly farmland a generation ago.
Why satellites see it clearly
Satellites like Landsat take pictures with each pixel covering about 30 metres. That is not enough to see single houses, but it clearly shows when fields turn into concrete and roads. Scientists use these images to measure how fast cities around the world are growing.
Cities and the environment
Rapid growth brought jobs and higher incomes, but also more traffic, air pollution and loss of farmland and wetlands. Shanghai has since added large parks and green belts and protected wetlands at the mouth of the Yangtze.
How to read the images
Fields look green or brown in small blocks, city looks grey, and the river looks brown-grey from the silt it carries. Haze can make city images look a little blurry.
For more years of change, explore Google Earth Timelapse (opens in a new tab), which shows Landsat images from 1984 to recent years for anywhere on Earth.
Frequently asked questions
When was Pudong developed?
The Pudong New Area was launched in 1990. Most of its famous skyline was built between the mid-1990s and the 2010s.
What is the tallest building in Pudong?
The Shanghai Tower, at 632 metres, finished in 2015.
Where do these images come from?
Both images are from NASA and USGS Earth-observing satellites (Landsat and the joint NASA HLS product). They are free public-domain data, and we host copies on our site.
More Earth then and now
Data and credits: Satellite images: NASA/USGS Landsat via NASA GIBS (Global Web-Enabled Landsat Data, 1985 annual composite) and NASA Harmonized Landsat Sentinel-2 (HLS), 2024-12-15, Sentinel-2 (HLS S30). Public domain (NASA/USGS); HLS Sentinel-2 data includes modified Copernicus Sentinel data, free and open. Imagery accessed through NASA Worldview/GIBS. Text written by ViralScopeHub from NASA Earth Observatory, USGS and other public sources. See all Live Earth & Space tools and our credits page.